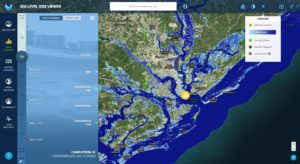
Sea Level Rise Viewer by National Oceanic and Atmospheric Administration (NOAA)
This tool allows for visualization of local-level coastal flooding caused by sea level rise, as well as supporting information on “data related to water depth, connectivity, flood frequency, socio-economic vulnerability, wetland loss and migration, and mapping confidence”.
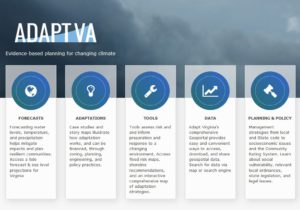
ADAPTVA
According to their website, ADAPTVA is a learning platform for individuals, local programs, and agencies interested in climate adaptation. This visualization tool allows exploration of the physical and social vulnerabilities by integrating the best available science, legal guidance, and planning strategies. It also includes legal and policy resources, stories that explain adaption through visual outputs, and mapping tools that address short and long-term sea level rise projections.
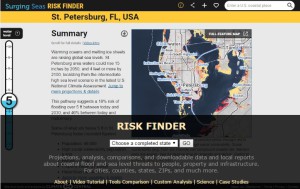
Surging Seas by Climate Central
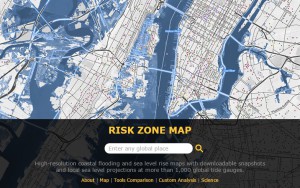
Climate Central recently updated their sea level rise and coastal flood risk tool Surging Seas by offering the new interactive mapping options to explore the sea level rise and flooding at different spatiotemporal scales: risk finder and risk zone map. This tools also support exploration of impacts on people, property, and infrastructure using 2010 U.S. Census data. The methodology utilizes lidar-based elevation data from the National Oceanic and Atmospheric Administration (NOAA) and sea level rise projections based on protocol described in paper by Vermeer and Rahmstorf (2009).
Coastal Relocation Leaf (CLR)
This visualization tool is designed to facilitate comprehension and exploration of circumstances under which relocation may emerge as a feasible adaptation option in coastal high-risk locations. Moreover, this communication tool supports learning of complexities and trade-offs associated with the possibility of relocation, as well as of dynamic interactions between the vulnerability to chronic and episodic coastal impacts, adaptive capacity to respond to these challenges, and the need for relocation. CRL is realized using Adobe Flash platform utilizing the intuitive logistic approach to establish main propositions and their associations visualized as a permutation of several different approaches to the same concept. Its artistic rendition is based on the key local scenario drivers affecting the relocation potential.


